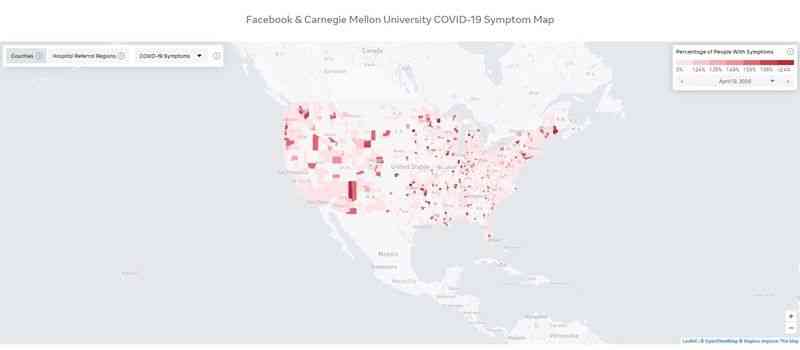
Facebook’s COVID-19 map displays symptoms by the county to county in the USA

Mark Zuckerberg has released a new COVID-19 map. It’s Facebook’s COVID-19 map. It shows an estimated percentage of COVID-19 symptoms, not confirmed cases. Facebook makes use of aggregated public data from the Carnegie Mellon University Delphi Research Center survey.
Facebook’s COVID-19 map displays symptoms by the county to county in the USA
Facebook has launched a series of measures in recent weeks to deal with the coronavirus crisis. The last one is a new interactive map showing the district county COVID-19 symptoms reported from users in the USA. Data obtained in partnership with Carnegie Mellon University through Facebook surveys will be updated throughout the epidemic. The company also announced that it plans to conduct symptom surveys globally in the coming days to create similar symptom maps for other countries where Facebook operates.
In a Facebook post, CEO Mark Zuckerberg shared the statistical page they made with the users. It is hoped that the maps will help local governments and public health officials better understand where resources will be allocated and when it is safe to finally reopen different locations.
About This Map
This map shows an estimated percentage of people with COVID-19 symptoms, not confirmed cases.
Facebook uses aggregated public data from a survey conducted by Carnegie Mellon University Delphi Research Center.
Facebook doesn’t receive, collect or store individual survey responses. This map is not intended for diagnostic or treatment purposes, or for guidance on any type of travel.
Facebook is not alone in maintaining its enormous impact on supporting coronavirus efforts. While Apple and Google are both working on a smartphone-based contract tracking system, Instagram co-founders Kevin Systrom and Mike Krieger recently launched rt.live, which uses metrics to track the real-time spread of COVID-19.
What is the rt.live?
RT (formerly Russia Today) is a Russian government-funded international television network. It operates pay television channels directed to audiences outside of Russia, as well as providing Internet content in English, Spanish, French, German, Arabic, and Russian.
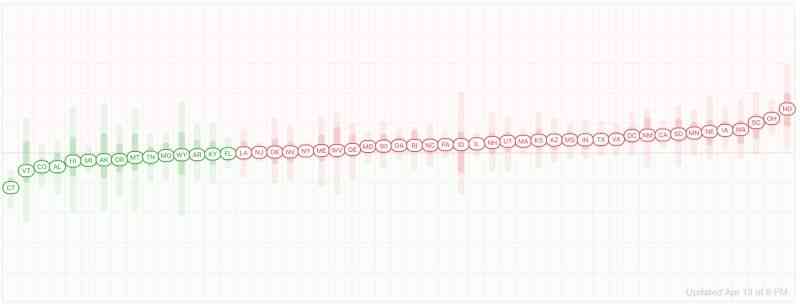
These are up-to-date values for Rt, a key measure of how fast the virus is growing. It’s the average number of people who become infected by an infectious person. If Rt is above 1.0, the virus will spread quickly. When Rt is below 1.0, the virus will stop spreading.
Meanwhile, Facebook is working on three new tools to help authorities better understand the spread of the virus – common location maps, range of trends and social connectivity index.
Maps will be launched in other countries this week.


