Nintendo Switch vs Nintendo DS Sales Comparison Charts Published

The chart and statistics website The VGChartz Gap releases monthly updated charts about consoles and games. This time, the website focuses on the 7th generation and the 8th generation Nintendo consoles to see how many consoles sold since the launch of these products. The sales chart includes worldwide sales by taking the first month as starting point.
Nintendo Switch Vs. Nintendo DS Worldwide
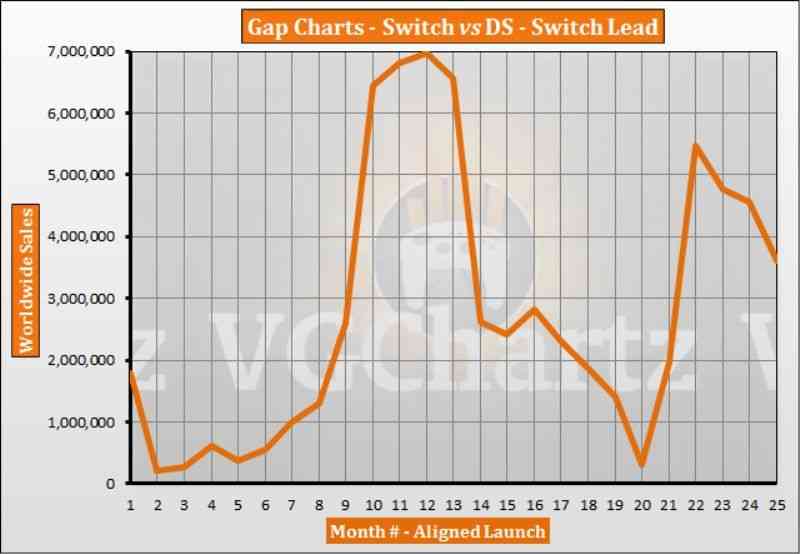
- Gap change in latest month: 942,664 – DS
- Gap change over last 12 months: 2,959,222 – DS
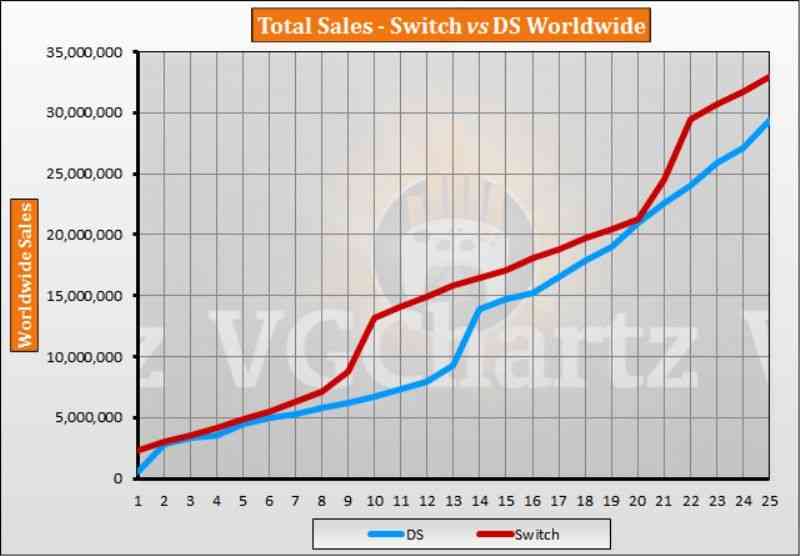
- Total Lead: 3,618,413 – Switch
- Switch Total Sales: 32,937,511
- DS Total Sales: 29,319,098
According to the given information, March 2019 is the 25th month of Nintendo Switch and compared to DS, Switch sold 942,664 unites more in this period. In the last 12 months, Nintendo DS reached 2,96 million sales and Nintendo Switch surpassed this number by reaching 3.62 million units. The DS launched in November 2004 in North America and 2005 in Europe, while Nintendo Switch launched worldwide in March 2017. You can check the charts and comparison below:


